
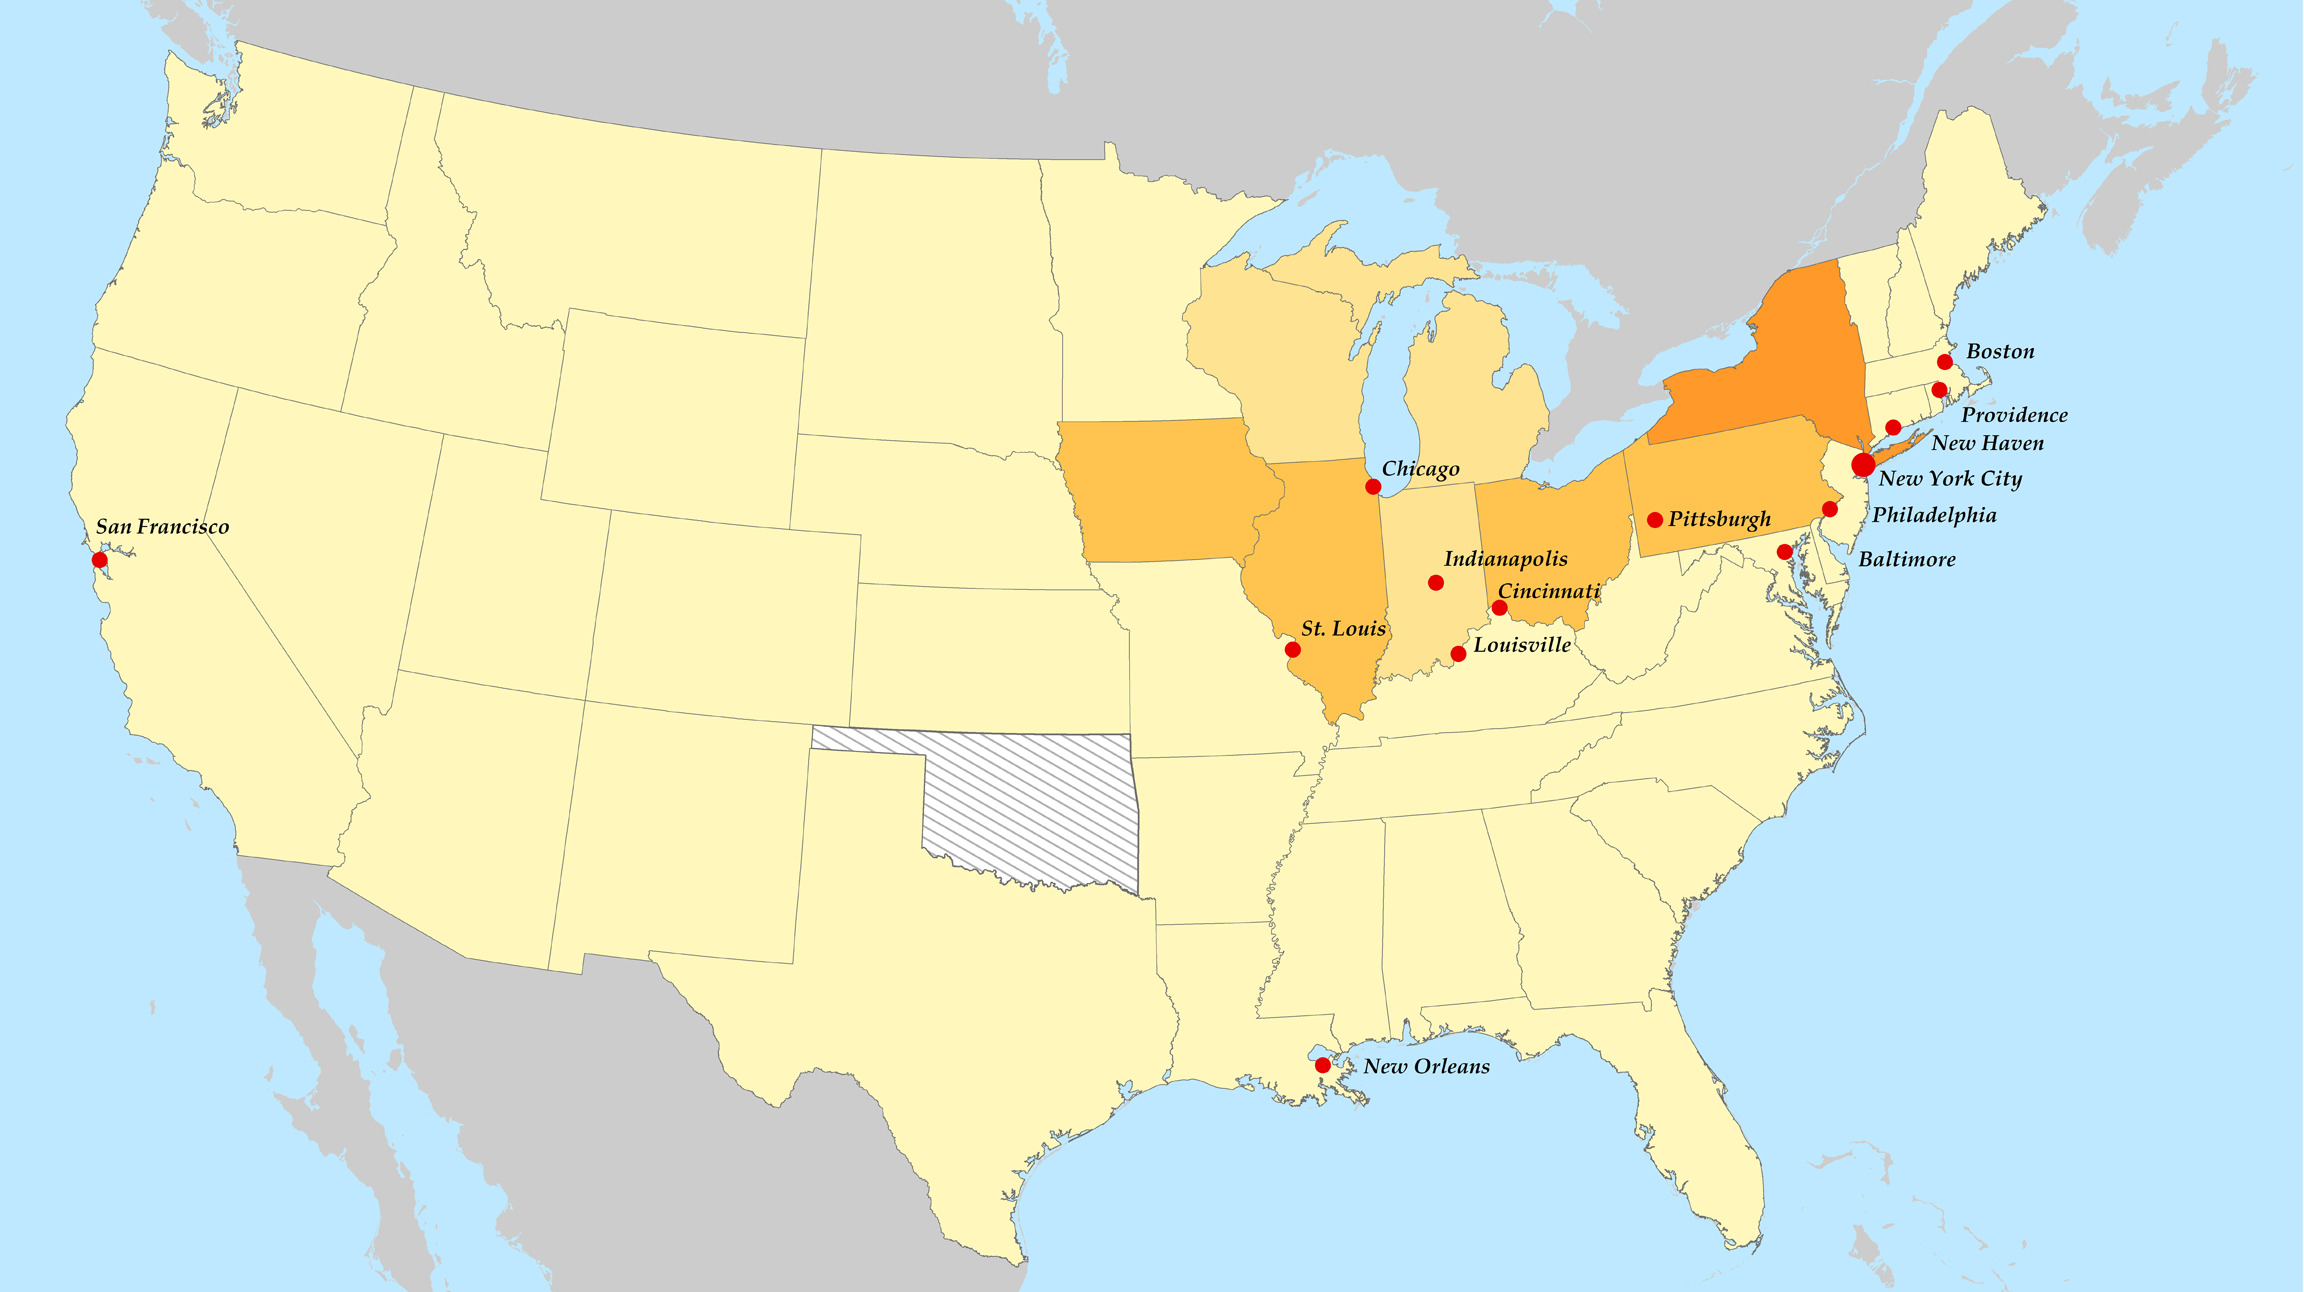

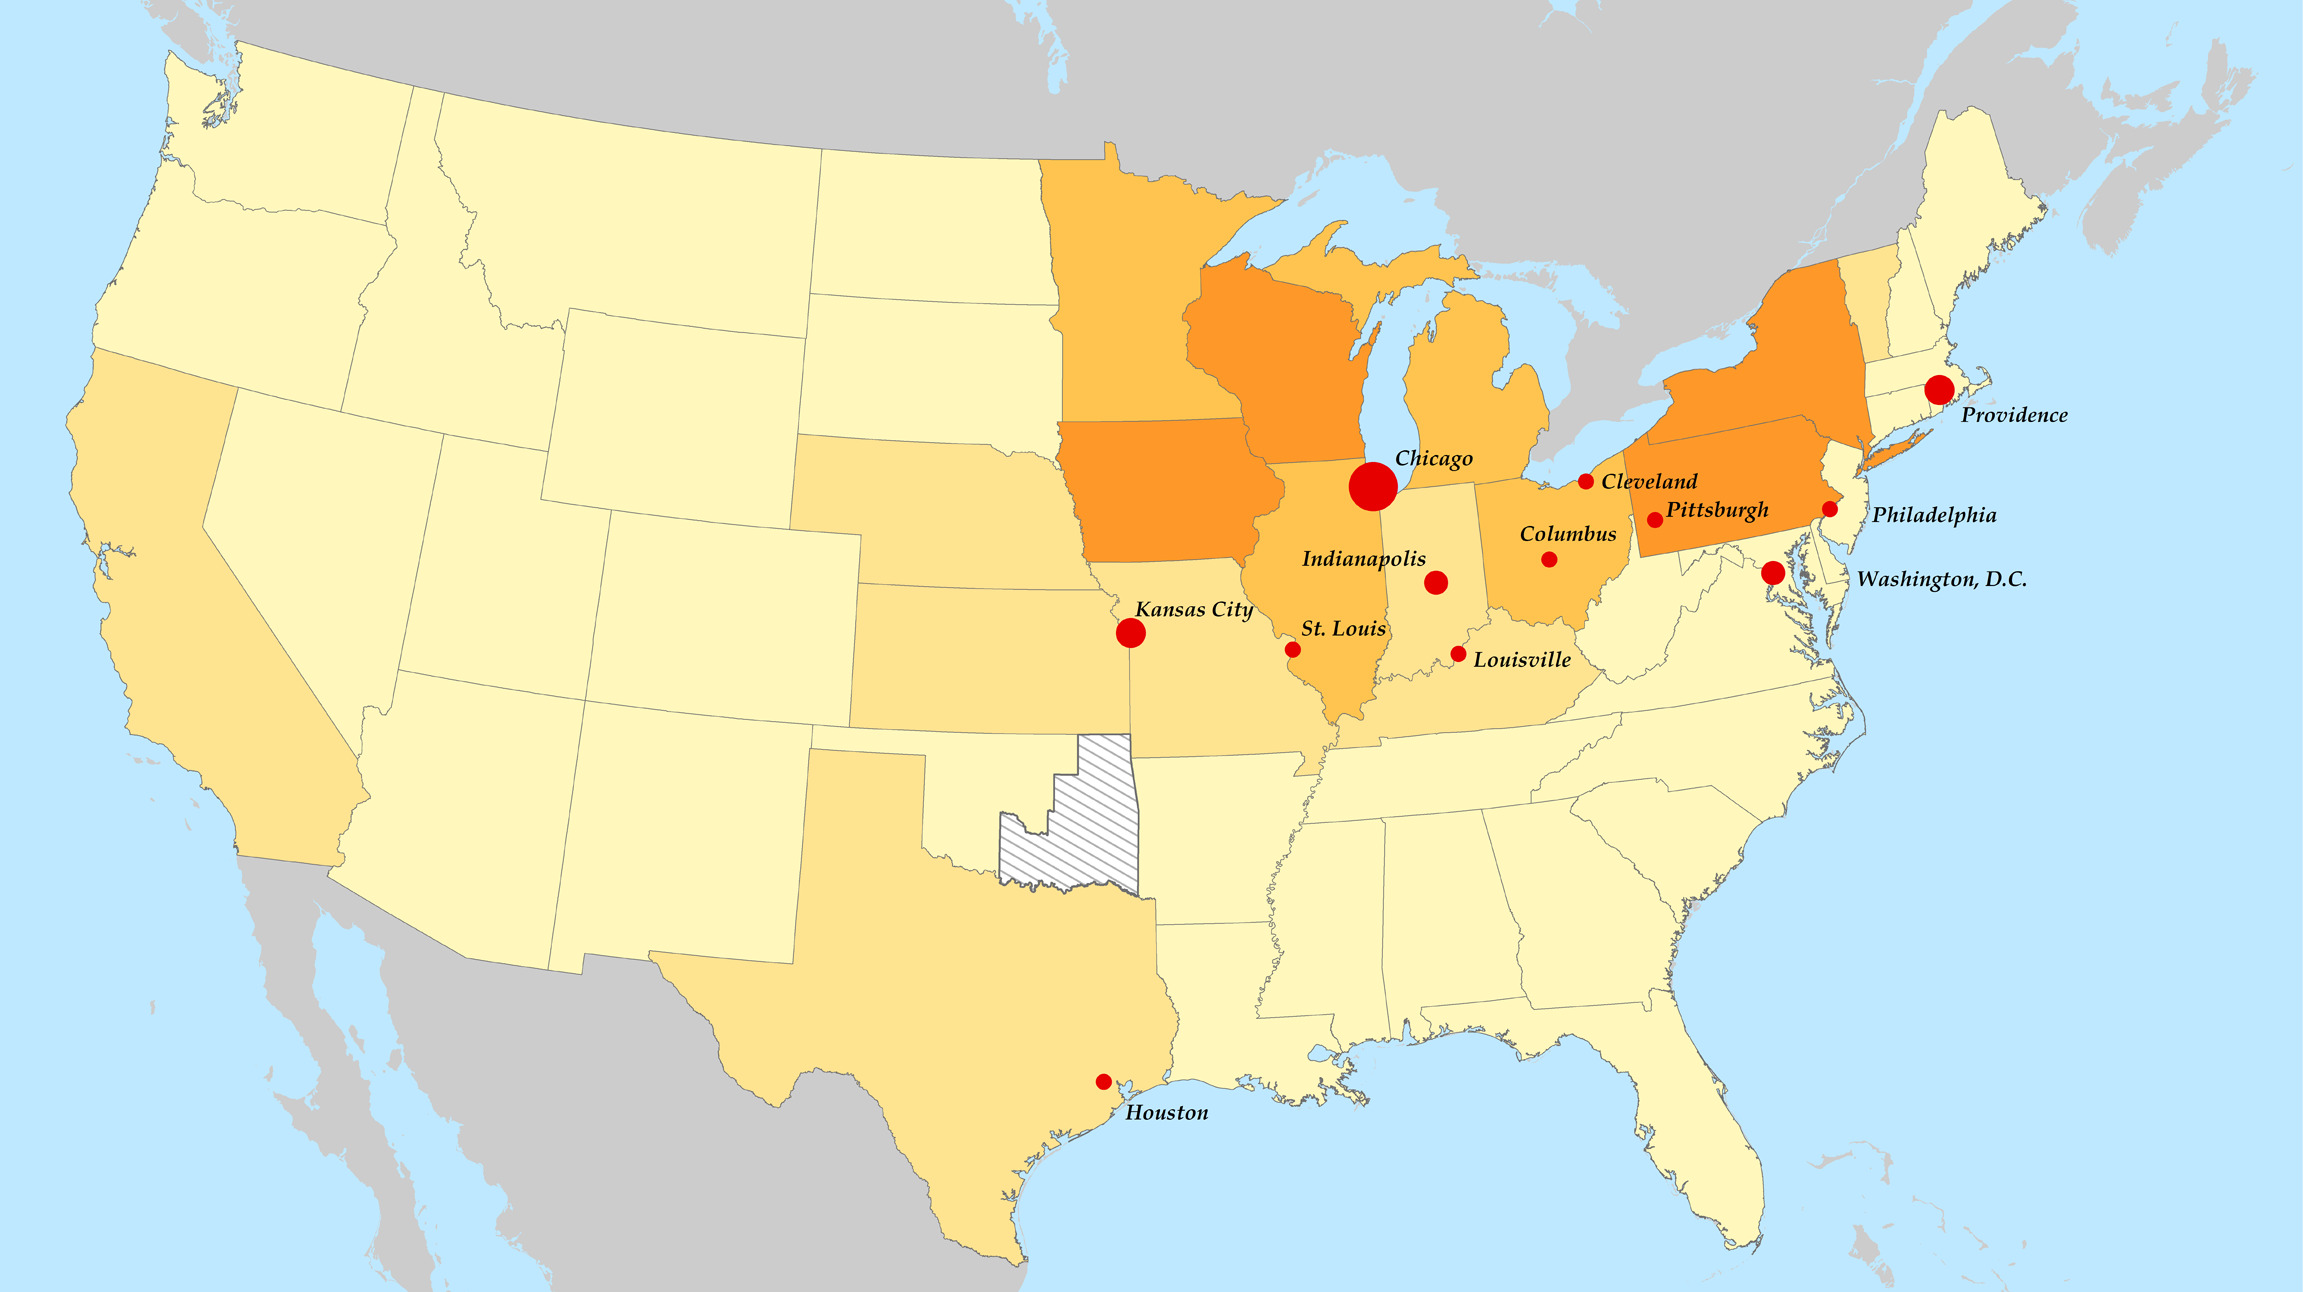

Butter Production
These maps show the growth of butter production on a state-by-state basis from 1870 to 1900. Beginning in 1880, they also show the proliferation of oleomargarine production facilities.
Playing the maps in sequence shows a subtle but visible shift in the dominant dairy states. In mid-century, the Northeast and upstate New York in particular were leaders in butter production. As settlement expanded across the continent, so too did butter production, shifting from the east of the Great Lakes to the west. Lake lands in particular were crucial for dairy production, because reliable water supplies kept grass and pasturelands flourishing for cows so that farmers could produce quality butter from their milk. After 1870, margarine factories sprouted first on the east coast (a consequence of Paraf’s early escapades) but became more prominent in the meatpacking Midwest by the turn of the century.
Source: Statistical Abstract of the United States, 1910 edition (pp. 147-148)