

Cottonseed Oil Crushing Mills
Cotton Production in 500 lb. bales
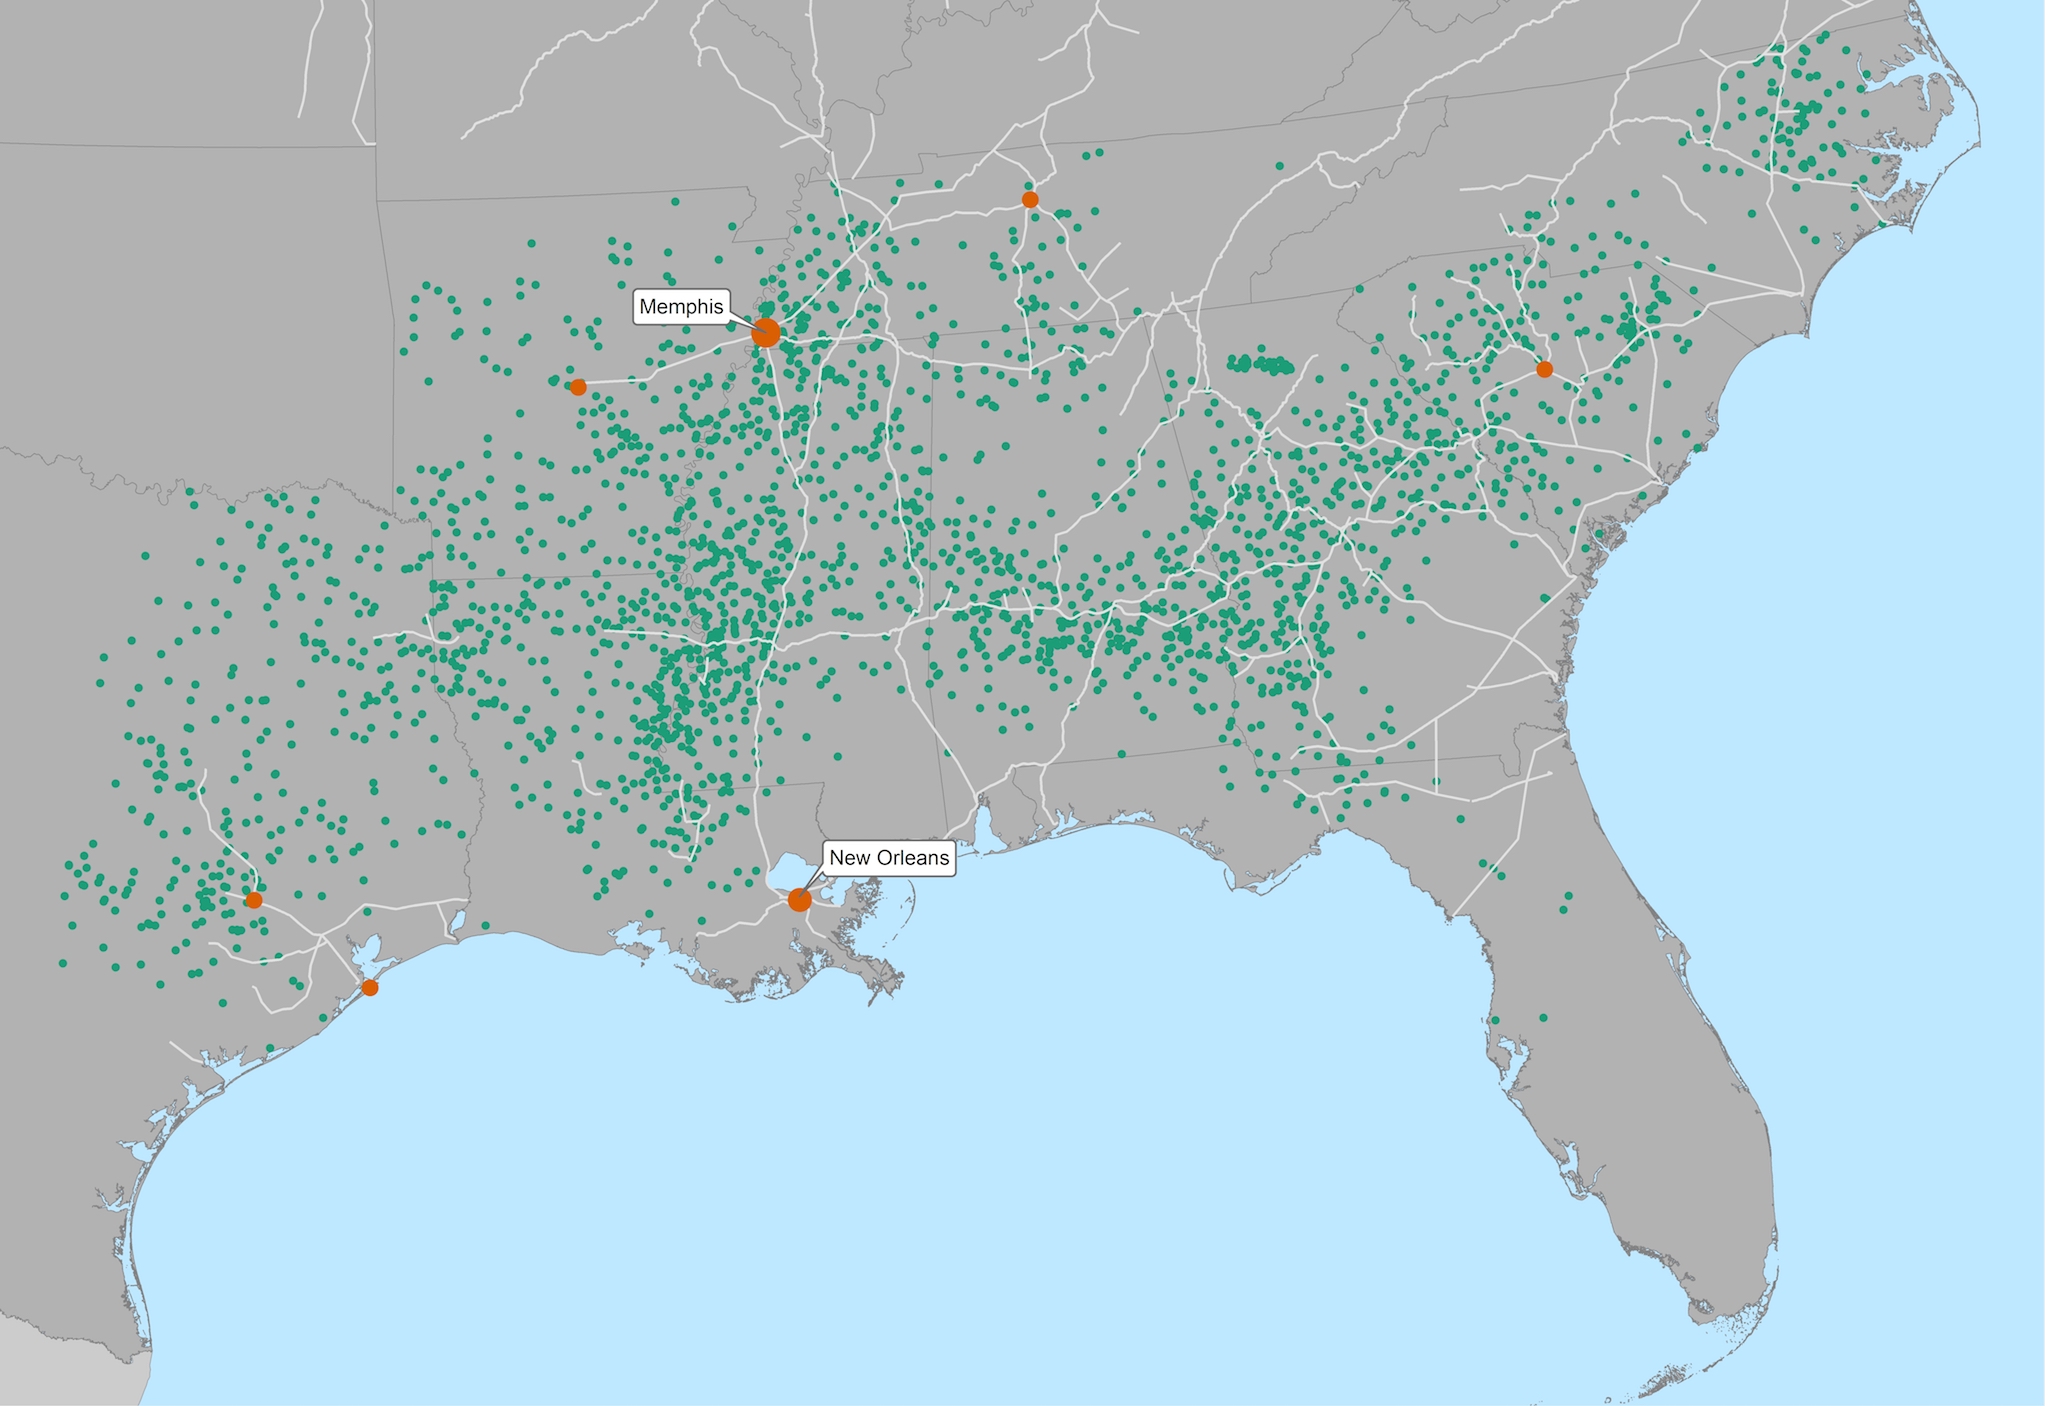
These maps illustrate the changing geography of cottonseed oil. In the postbellum period, cotton growers began to crush their formerly discarded cottonseeds to collect oil. The organic oil was then used to mix (adulterate) olive oil in the Mediterranean and to blend with lard (pig fat) from meatpackers in the Midwest. Crushing seeds was a new industry. It used a byproduct of the cotton empire to generate a new market. It also furthered the reliance on cotton as a staple crop in the South and Texas.
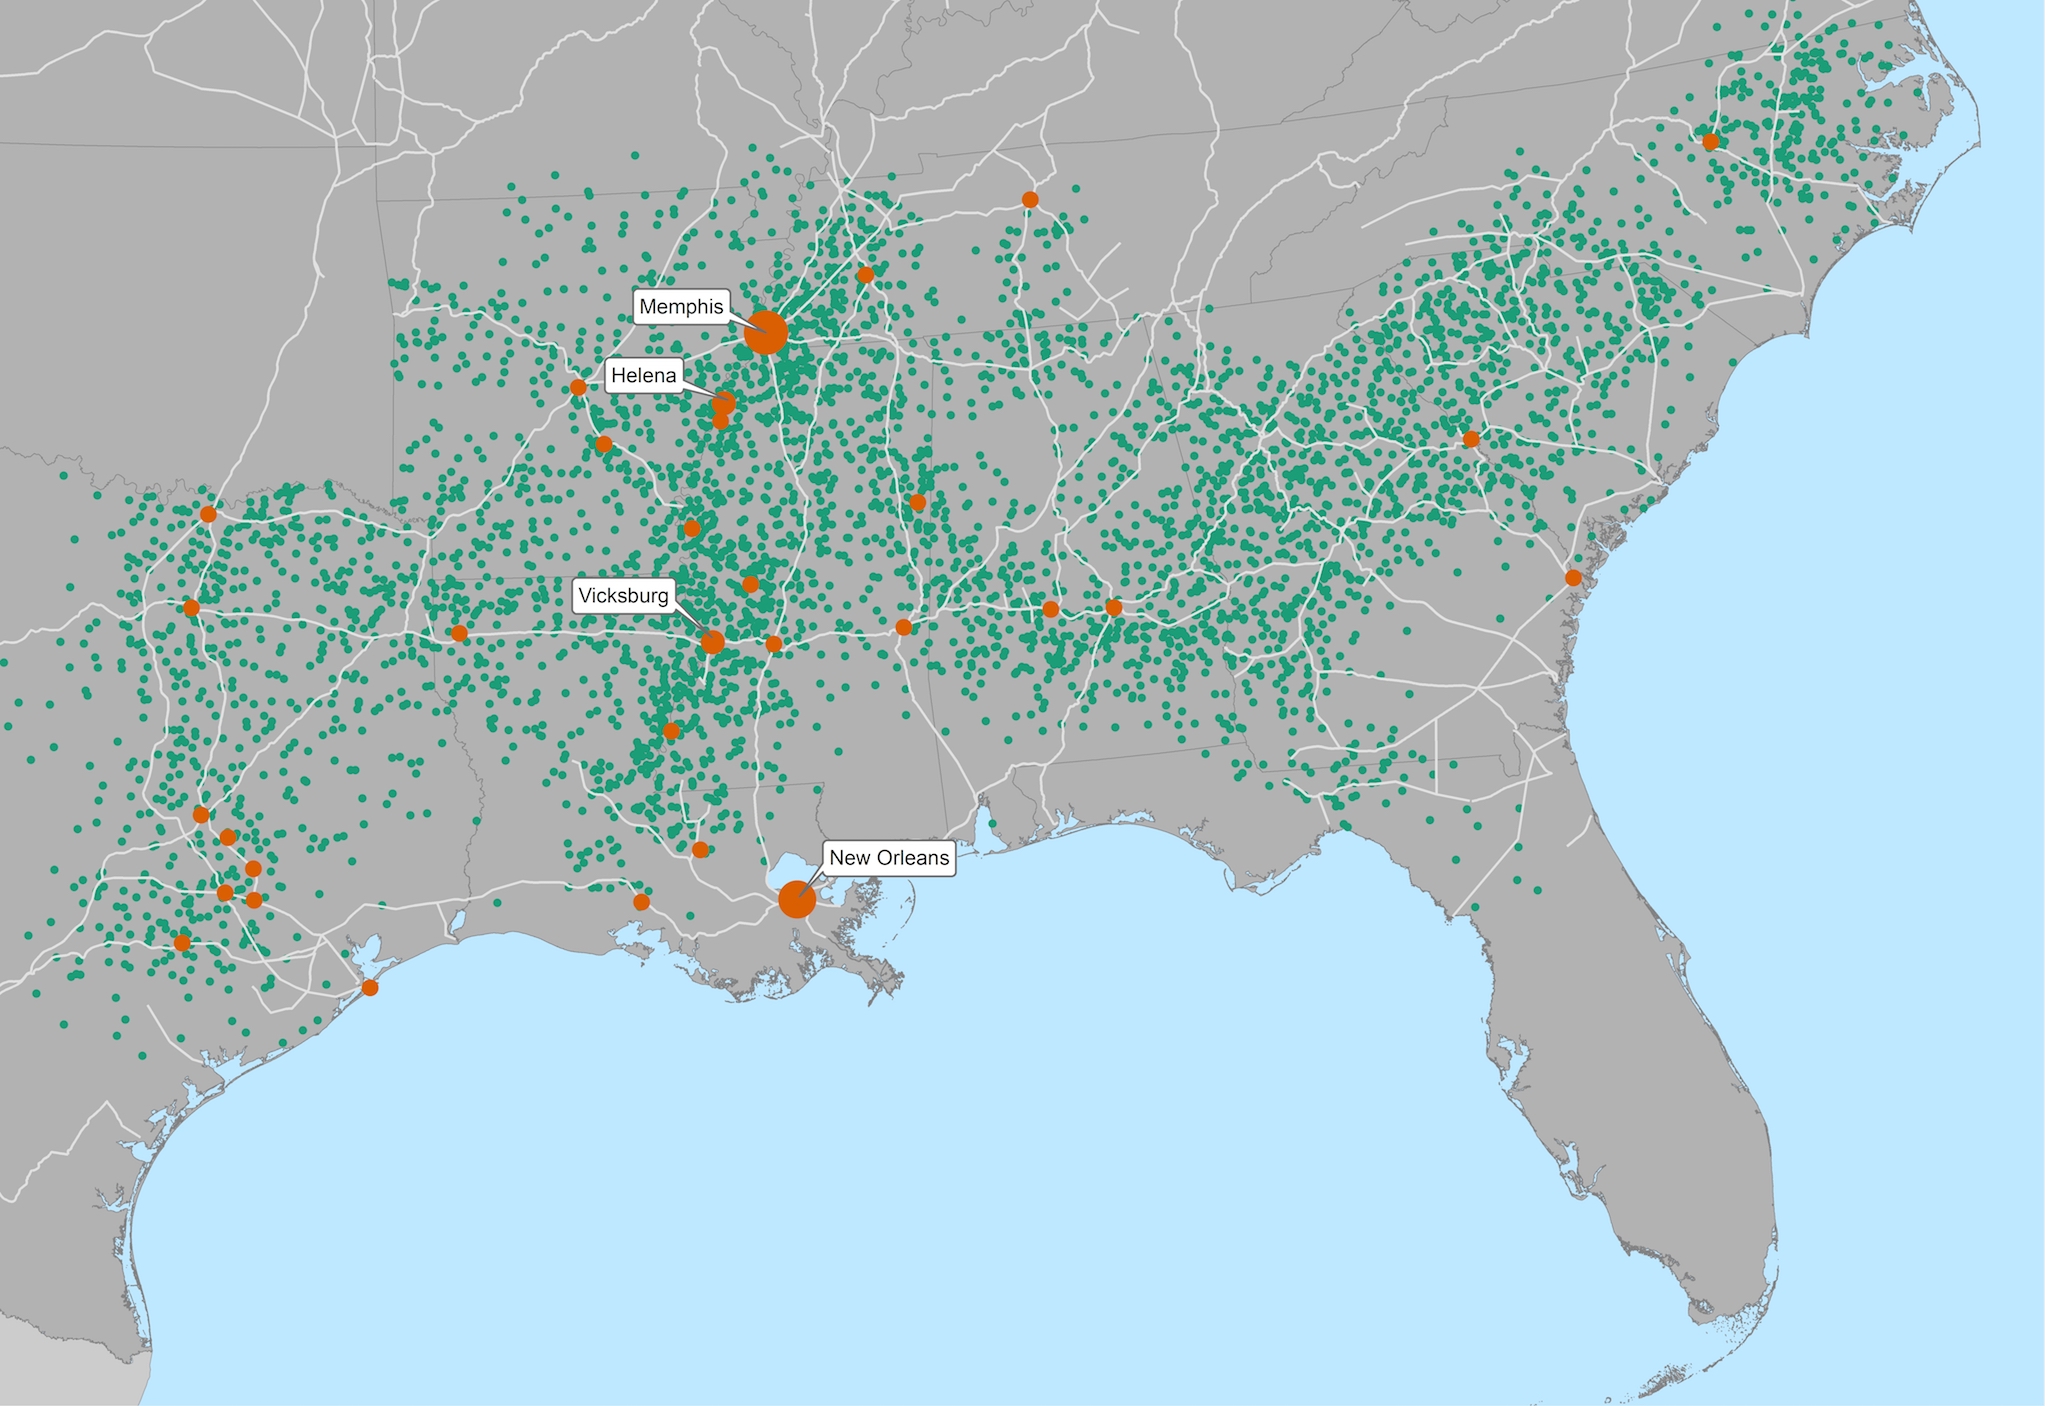
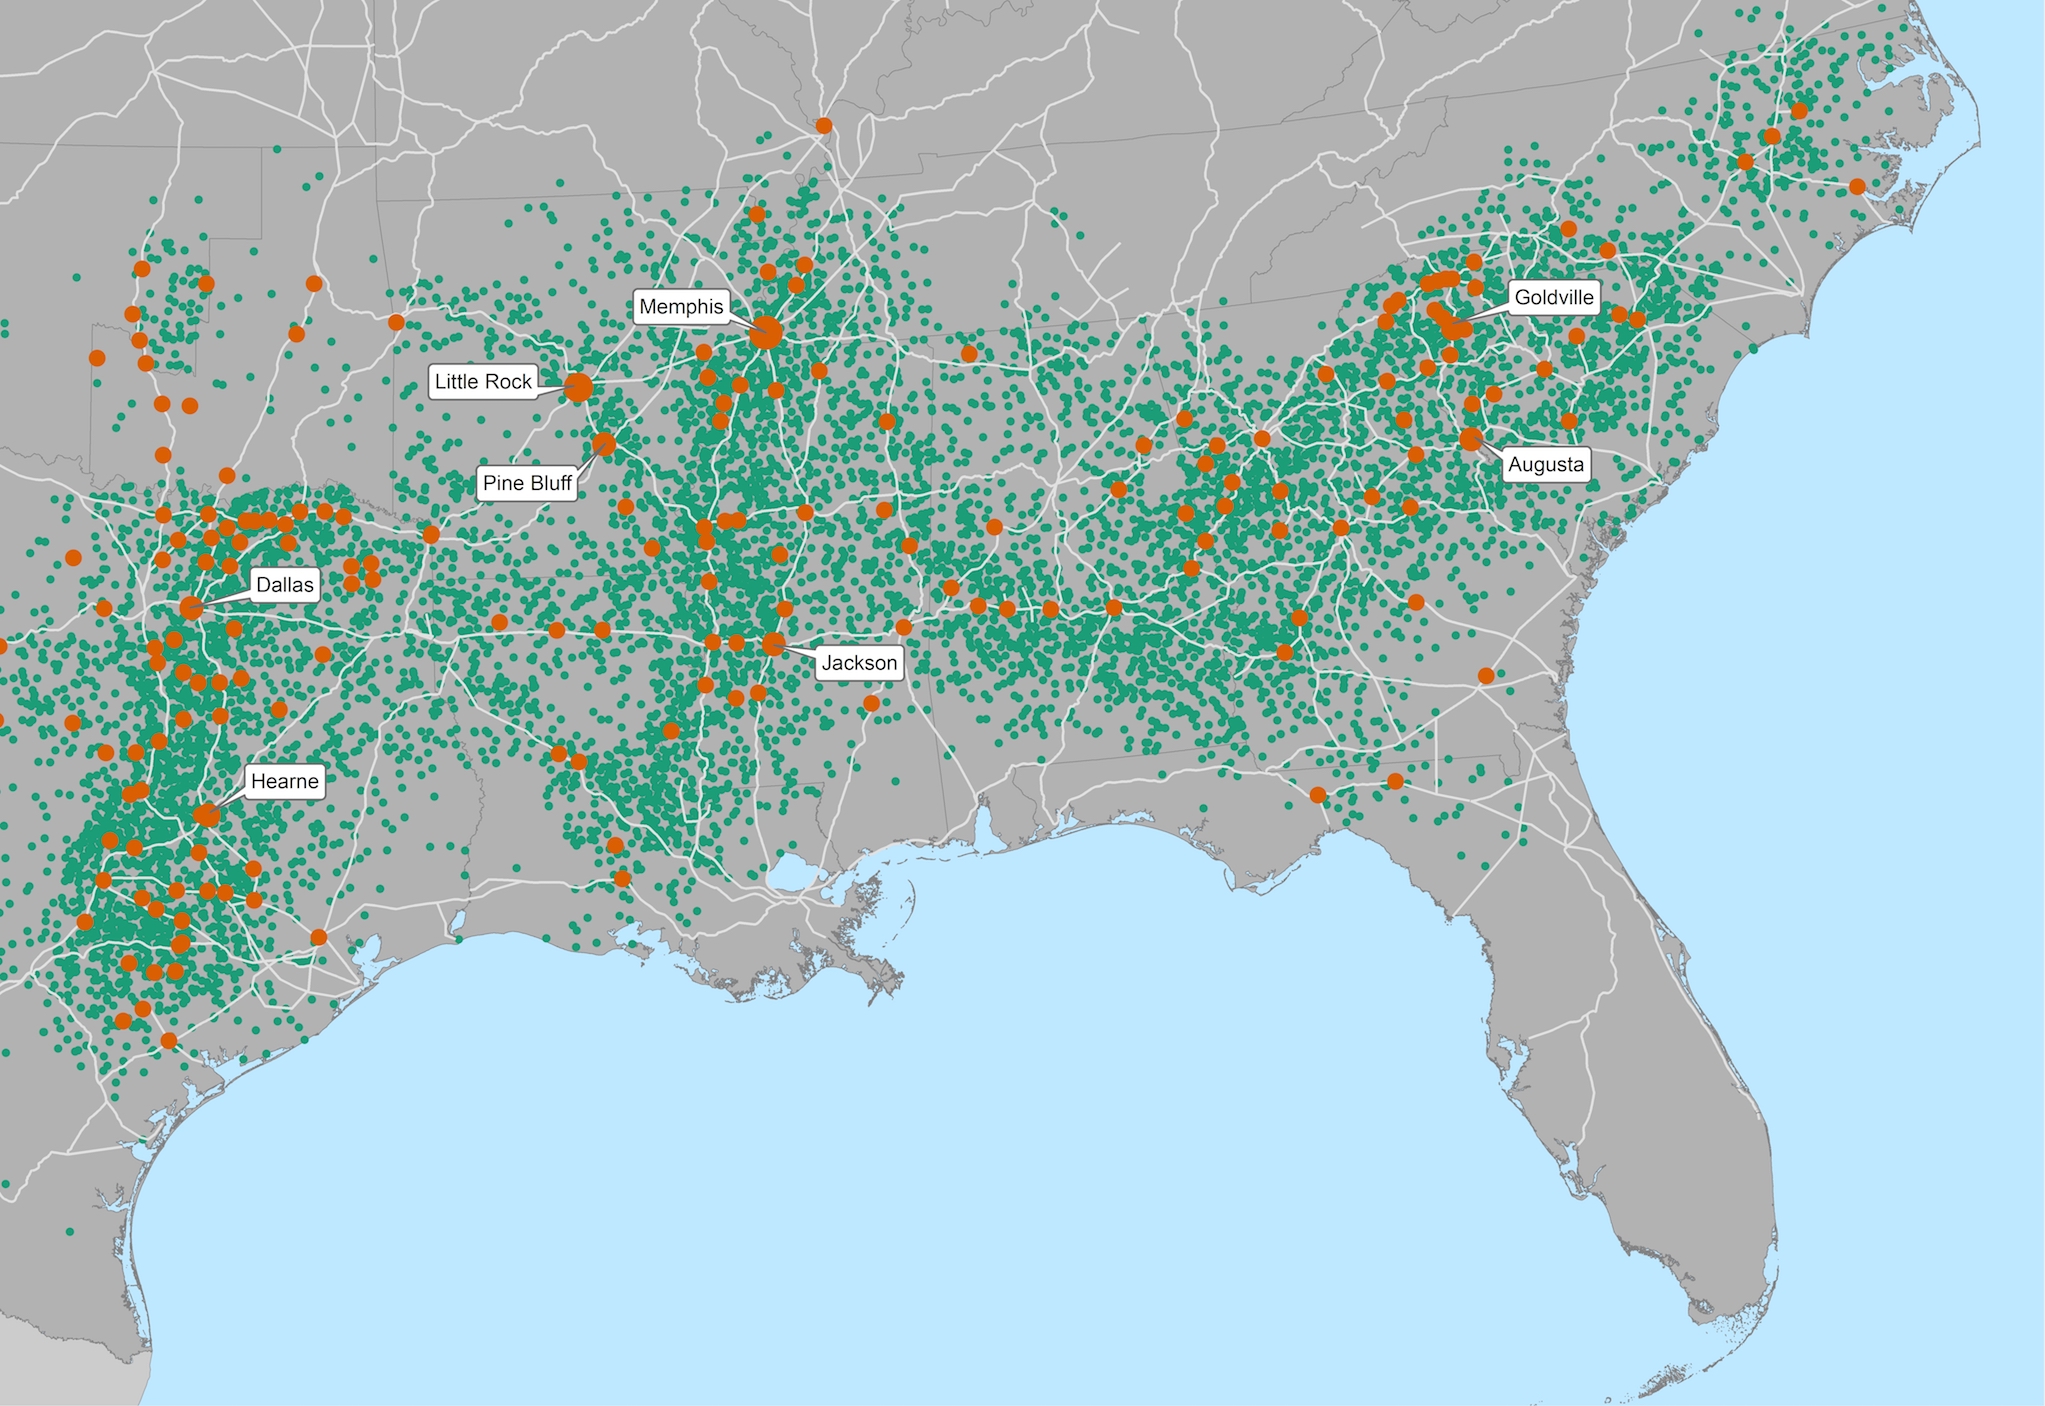
The two layers of the maps show two features changing over time. One is the growth of cotton production; the second is the rise of the cottonseed oil crushing industry. As the legend notes, each green dot represents 1000 bales of cotton, while the size of the red dot indicates how many crushing mills each state had.
The crushing industry was nearly non-existent in 1860. It grew to mills in the dozens in the 1870s and then in the several hundreds by the early 1900s. By that point, cottonseed oil was a common component in the consumer product market. Shortening, meatpacking, and grocers’ companies—like N.K. Fairbanks’ Cottolene and Proctor and Gamble’s Crisco— developed new markets built on the regular supply of the organic oil from the South. The purpose of the maps is to show the geographical path of cottonseed oil in relation to the growth of cotton production itself. These maps help illustrate a new layer of southern economy with the rise of the oil by-product industry.
Sources: Bureau of the U.S. Census, 1860, 1870, 1880, 1900; Manufacturers’ Record, 1887, 1916; Oil, Paint, and Drug Reporter.